I don’t spend a lot of time worrying about the website traffic numbers for API Evangelist. Once a week I’ll take a look at my Google Analytics or CloudFlare dashboards. I don’t write for page views, but I do like to know which of my areas of research is of interest to the public, and generally what people are clicking on.
To help me visit my numbers each week, I started publishing them to the API Evangelist repo, and sharing via a new numbers section on the site.
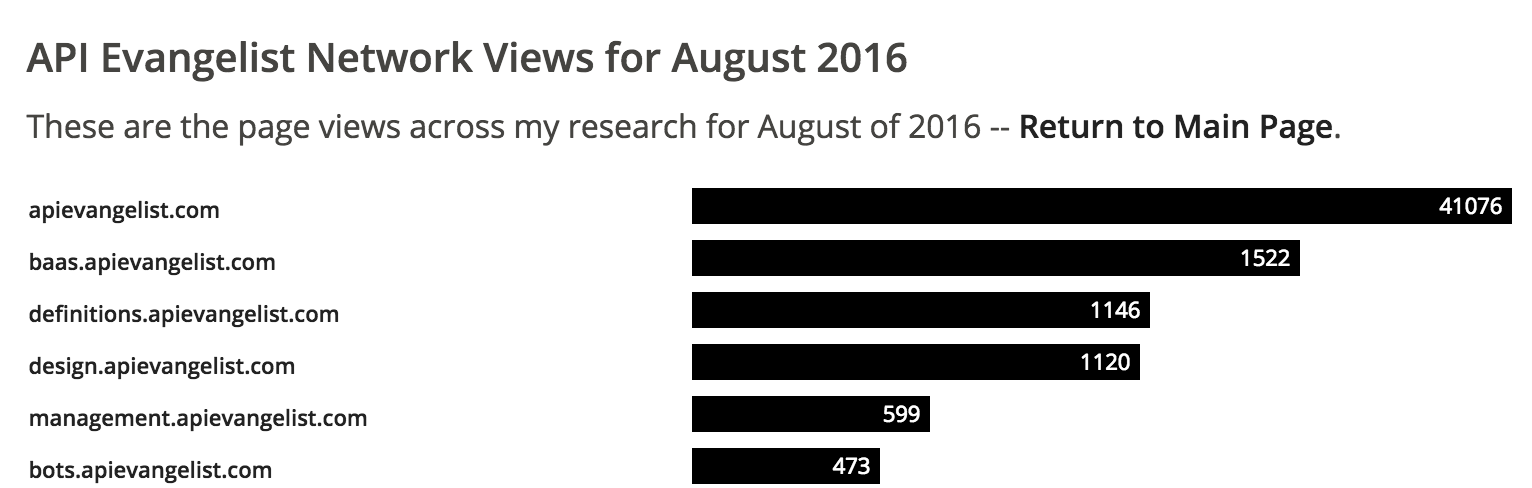
I wanted to start with seeing the page views across all of my API research projects, giving me an idea of the interest levels in each area:
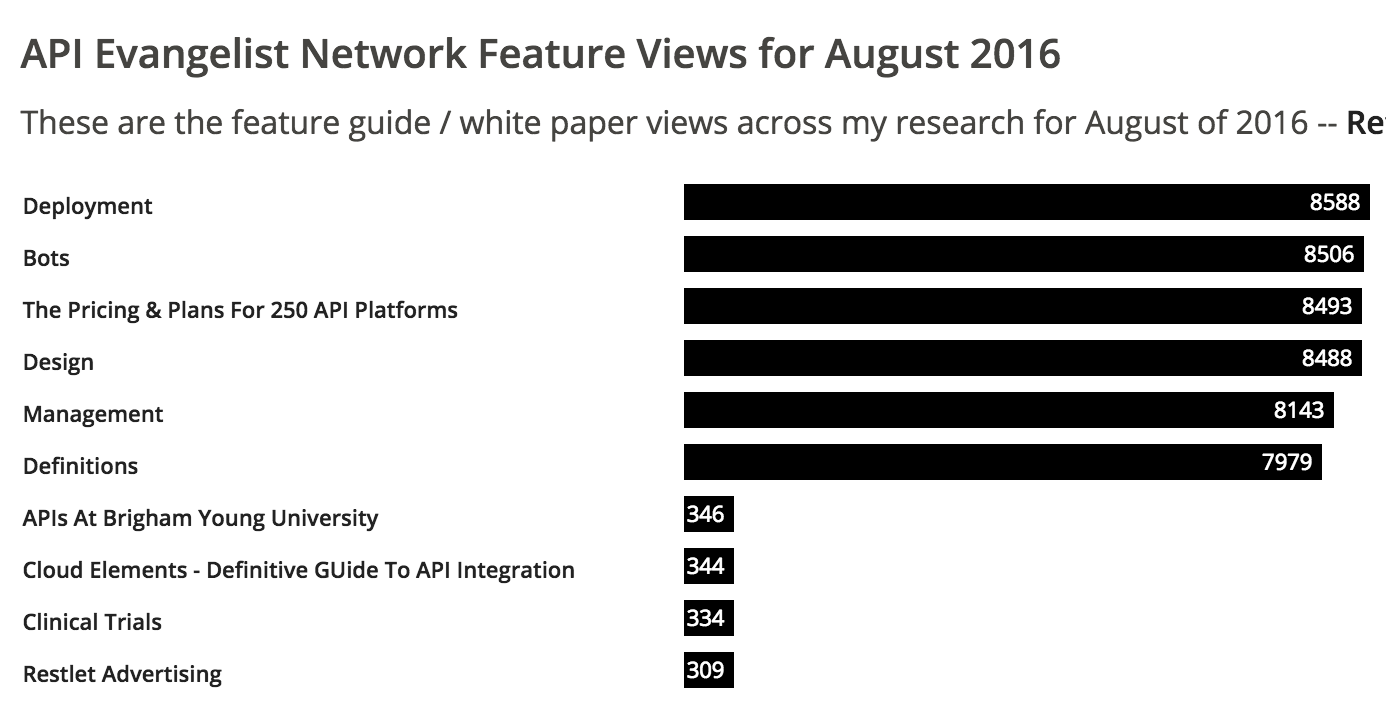
Next, I wanted to see the page views that each guide or white paper was getting in the top left corner of my site:
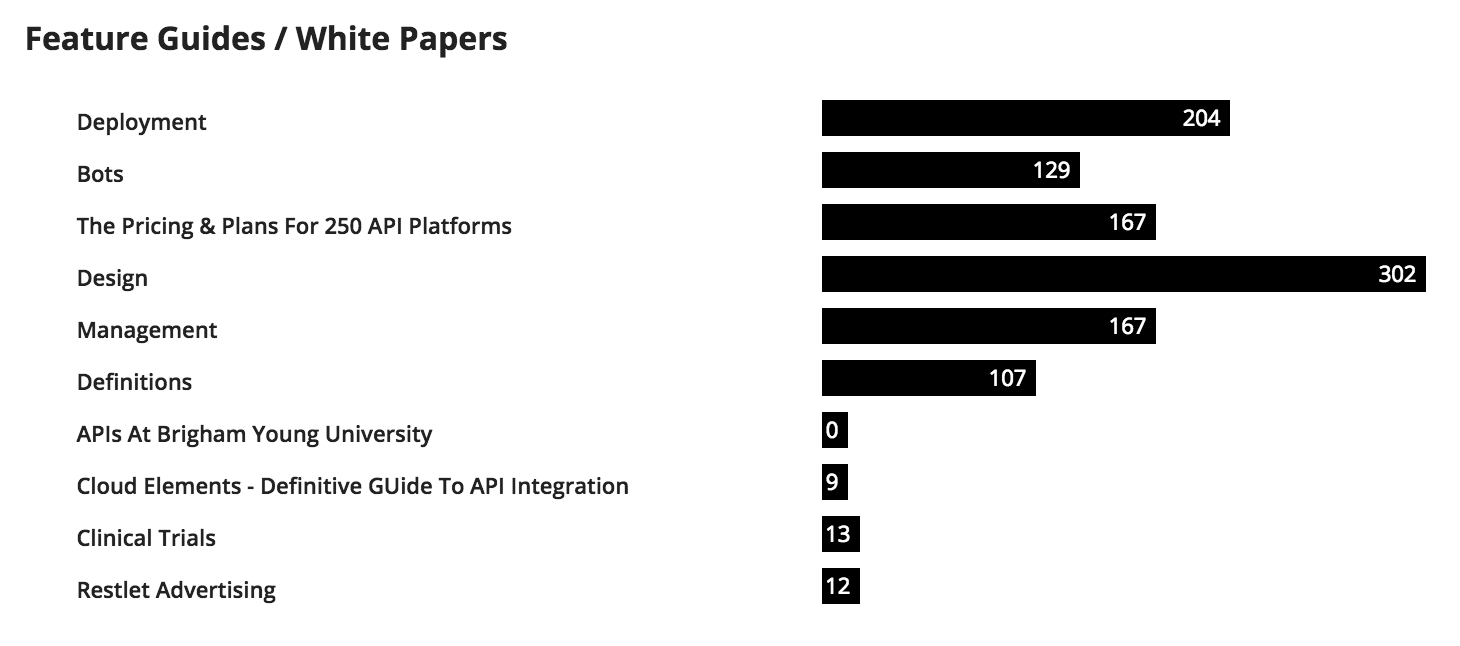
After the views, I wanted to get a better understanding of what people were clicking on when it came to these guides & white papers:
I also wanted to see which of the sponsor logos I include on the left-hand navigation were being clicked on by my readers:
![]()
Numbers do not drive what I do. I research and write about what grabs my attention, not based upon what drives traffic. However, I do like sharing these basic numbers with my partners, and readers, so that they can get a feel for my reach, and what areas of my research are of interest to the public.
The numbers reports are simple static views of activity across my sites. I will publish the JSON that drives the reports each week, along with the rest of my industry monitoring each week. Once I get enough data published to do some quarterly reports I will work to slice and dice, and see what I can come up with when it comes to visualizations. I’m enjoying playing with D3.js as a visual layer to the JSON data that I’m publishing to Github, across my API industry research–the problem is that I can get lost for hours doing this.