My partners in crime Metadata Technologies North America (MTNA) and I are working on identifying the best election data and API resources available today, and one of the gems out there, when it comes to what is available is out of the politics and sports data platform FiveThirtyEight. The data storytelling platform have made a name for themselves when it comes to predicting election outcomes, and possess some very interesting datasets around elections, which they public via a simple landing page, and on GitHub in a public repository.
- FiveThirtyEight Data Page - A simple page outlining all their data resources.
- FiveThirtyEight Data Repo - All the datasets they have in a single GitHub repo.
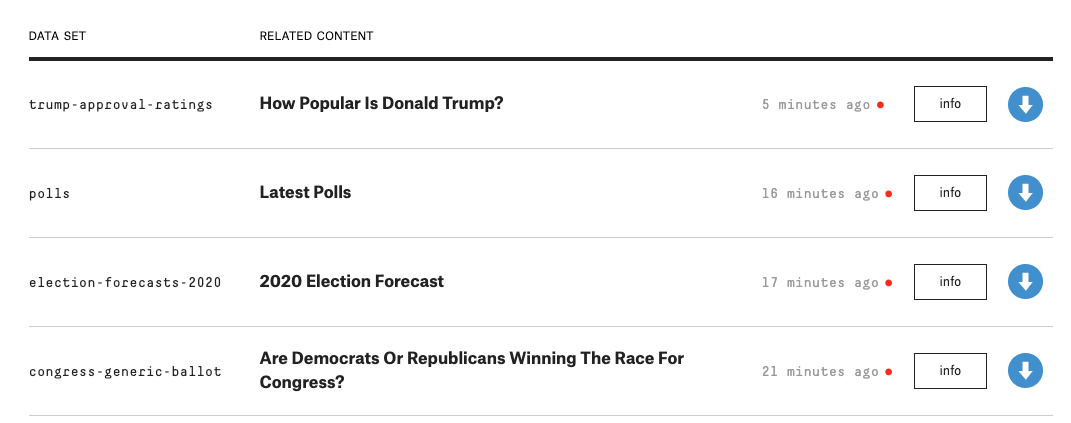
FiveThirtyEight has general poll data, but also data for more precise questions like “How Popular is Donald Trump?”, and “Are Democrats or Republicans Winning the Race for Congress?”. They provide data as CSV files via their data page and on GitHub, making it easy to get at the data behind polling and storytelling. I am working with MTNA to take things a step further, and ingesting the data files and publishing them as simple APIs, then generating collections that index all the APIs, making it easier to access all the election related files in a single collection, while also opening up the possibilities for using Postman visualizer to make sense of the data being returned. Providing self-contained API client for all the data, complete with charts, graphs, and other eye candy that make it easier to understand what is happening.
I really like the happening approach to publishing the data via their dedicated page because it is dead simple, providing a title, more info, and a CSV download, as well as column saying how long it has been since it was updated—down to the minute. Providing everything you need to understand what is going on with each dataset.
This got me thinking about the real time opportunities involved with making the data available to consumers, which is a good reason to start making the data available via APIs. It makes it easier for us to poll (ha! polling poll data!), and then provide webhooks and other real time capabilities. It also allows us to establish a feedback look with consumers. While the data is made available publicly without authentication, we can still understand usage across different types of consumers. MTNA and Postman are working to help add this additional API layer on top of FiveThirtyEight, as well as a Postman collection layer to help us make the data more accessible, publish richer documentation, visualizations, and other elements that help make the data more usable.
MTNA has pulled all the relevant FiveThirtyEight data sets and published as an API, repeating the process on a schedule to keep fresh. They have also generated a rich Postman collection (which I will share soon), which aggregates all of the available datasets into a single place, while also augmenting with visualizations using Postman Visualizer. Next we are looking for other datasets that would compliment the polling data, further helping us make sense of what is going on. If you know of additional election related datasets that would add value, or would like to develop a dataset or API, I’d love to hear more about it. Also, if you work at FiveThirtyEight, or know someone who does, I’d love to learn more about their data pipeline, as well as the storytelling and visualization that happens on top of this data. I have a regular series of campaigns planned for this fall that I would love to make as robust and useful as I possibly can for developers.