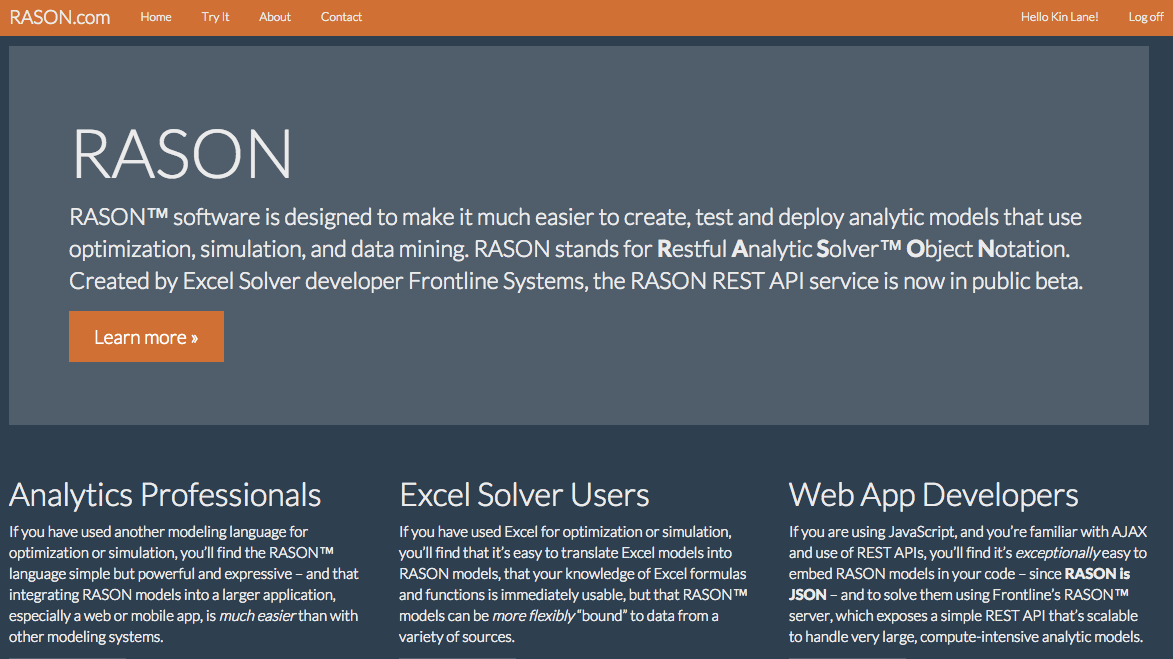
I came across an interesting piece of technology today while doing new curation for API.Report. RASON, an interesting approach to API driven analytics and potential UI and visualization, that kind of resembles what I have been envisioning for one possible future. The analytics tool is created by a company called Frontline Systems, and I’ll let them articulate what it is:
RASON™ software is designed to make it much easier to create, test and deploy analytic models that use optimization, simulation, and data mining. RASON stands for Restful Analytic Solver™ Object Notation.
RASON targets analytical professionals, excel power users, and web app developers, but here is where it gets over my head, “Problems you can solve with the RASON service include linear programming and mixed-integer programming problems, quadratic programming and second-order cone problems, nonlinear and global optimization problems, problems requiring genetic algorithm and tabu search methods – from small to very large.” — sounds impressive to me!
I signed up and played with RASON a little bit, but it wasn’t as intuitive as I hoped. I think I have a little more to learn about RASON. The RASON models are very cool, I like the airport hub, I just don’t have enough knowledge to make it work right now, however I’m digging the idea, and it reflects what I’ve been seeing in my head when it comes to defining API driven analysis--when you connecting that with API generated visualizations, hypermedia, spreadsheets, APIs.son, and more—I start to get a little too excited.
Anyhoo. Just sharing a new technology that I found. Once I learn more about RASON, hopefully I will be able to see where RASON fits into the bigger API life-cycle, and share a little more.